
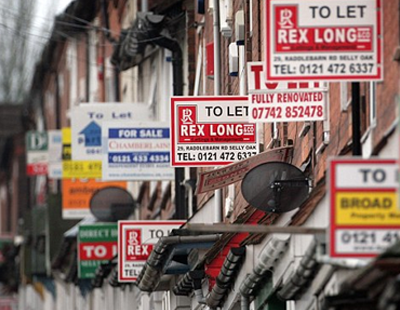
UK rental prices fell for the first time in eight years in May, according to the latest HomeLet Rental Index.
The figures reveal that the average monthly cost of a new tenancy dropped to £901 per calendar month in May, down 0.3% from £904pcm in the corresponding month last year.
It is the first time since December 2009 that HomeLet's rental index has measured a year-on-year fall in rent prices. The pace of rental price inflation has been slowing in recent months after peaking at 4.7% last summer.
Last month, HomeLet reported that new tenancies on rents in London fell to £1,502 from £1,519 in April 2016 - the first annual decline in almost eight years.
A further decline in average rents on new tenancies in the capital last month, along with annual falls in the North East, Scotland, South East and Yorkshire and Humberside, continued to place downward pressure on rental price across the country as a whole.
The slowdown in the rental sector reflects a wider trend in the housing market, with Nationwide Building Society revealing in June that house prices had fallen between March and May.
Martin Totty, chief executive of Barbon Insurance Group, HomeLet’s parent company, said: “Landlords are now facing a difficult balancing act between ensuring rents are affordable for tenants in a low real wage growth environment whilst covering their own rising costs.
“Tenants will still need a vibrant and growing rented sector to provide them with property options at the time of their choosing. Any constraint to the supply of rental properties, because landlords are unable to achieve the reasonable returns they require, cannot be in the long term best interests of tenants, especially if, as we’ve now heard from all the main political parties, the UK’s population continues to grow.”
Rental figures from the May 2017 HomeLet Rental Index
|
Region
|
Average rent in May 2017
|
Average rent in April 2017
|
Average rent in May 2016
|
Monthly variation
|
Annual variation
|
|
East Midlands
|
£614
|
£604
|
£595
|
1.6%
|
3.3%
|
|
North West
|
£679
|
£677
|
£664
|
0.2%
|
2.2%
|
|
South West
|
£803
|
£802
|
£787
|
0.2%
|
2.1%
|
|
Wales
|
£605
|
£610
|
£594
|
-0.8%
|
1.8%
|
|
East of England
|
£909
|
£904
|
£904
|
0.5%
|
0.6%
|
|
Northern Ireland
|
£609
|
£614
|
£606
|
-0.9%
|
0.4%
|
|
West Midlands
|
£658
|
£661
|
£656
|
-0.5%
|
0.3%
|
|
Yorkshire & Humberside
|
£614
|
£619
|
£618
|
-0.7%
|
-0.6%
|
|
South East
|
£998
|
£1,003
|
£1,014
|
-0.4%
|
-1.5%
|
|
Scotland
|
£622
|
£632
|
£634
|
-1.6%
|
-1.9%
|
|
North East
|
£522
|
£525
|
£534
|
-0.7%
|
-2.3%
|
|
Greater London
|
£1,502
|
£1,519
|
£1,548
|
-1.1%
|
-3.0%
|
|
UK
|
£901
|
£904
|
£904
|
-0.3%
|
-0.3%
|
|
UK excluding Greater London
|
£753
|
£754
|
£750
|
-0.1%
|
0.5%
|
|
Notes:
|
Based on new tenancies in May 2017
|
Based on new tenancies in April 2017
|
Based on new tenancies in May 2016
|
Comparison of average rent in May 2017 and April 2017
|
Comparison of average rent in May 2017 and May 2016
|
Want to comment on this story? Our focus is on providing a platform for you to share your insights and views and we welcome contributions.
If any post is considered to victimise, harass, degrade or intimidate an individual or group of individuals, then the post may be deleted and the individual immediately banned from posting in future.
Please help us by reporting comments you consider to be unduly offensive so we can review and take action if necessary. Thank you.


.png)


Join the conversation
Be the first to comment (please use the comment box below)
Please login to comment